

An Associate Website of Indiastat.com

Visualise Data with Charts & Maps
Nagalandstat.com is now providing facility to create various charts and India's map with state boundaries and created charts can be saved in .jpg, .pdf and .png file formats and maps in .png file format.
This facility is being offered to its registered subscribers only.
Visualise Data with Charts & Maps
Nagalandstat.com is now providing facility to create various charts and India's map with state boundaries and created charts can be saved in .jpg, .pdf and .png file formats and maps in .png file format.
This facility is being offered to its registered subscribers only.
Existing Subscribers please login to proceed.
 Visualise Data with Charts & Maps
Socio-Economic Statistical Information about Nagaland
Administrative Units
Agriculture
Banks and Financial Institutions
Civil Supplies and Consumer Affairs
Companies
Cooperatives
Crime and Law
Demographics
Economy
Education
Environment and Pollution
Foreign Trade
Forest and Wildlife
Geographical Data
Health
Housing
Industries
Insurance
Labour and Workforce
Media
Meteorological Data
Mines and Minerals
Per Capita Availability
Petroleum
Power
Rural and Urban Areas
Social and Welfare Schemes
Sports
Telecommunication
Tourism
Transport

Health
Disabled Population Diseases Family Welfare Health and Family Welfare Projects Health Education Health Infrastructure Health Man Power Immunization National Family Health Surveys (NFHS) Nutrition Social Consumption on Health Vital Statistics
Nutrition
- Nutrition Intake (July 2011 - June 2012)
- Performance under Nutrition Programme (2002-2012)
- Status of Malnutrition among Children below Age of 5 Years in Nagaland (As on December, 2011)
- Anthropometric Measurements by Age and Sex (Height and Weight) in Nagaland (1995-1996)
- Average Food Consumption According to Age and Sex in Nagaland (1995-1996)
- Average Food Consumption in Nagaland (1995-1996)
- Average Intake of Nutrients According to Age and Sex (per Day) in Nagaland (1995-1996)
- Average Intake of Nutrients in Nagaland (1995-1996)
- District-wise Different Prevalence rates of CED in Nagaland (1995-1996)
- District-wise Inadequate Average Consumption of various Foodstuff in Nagaland (1995-1996)
- District-wise inadequate Nutrients Intake in Nagaland (1995-1996)
- District-wise Intake of Nutrients in Nagaland (1995-1996)
- District-wise Nutritional Indicators in Nagaland (1995-1996) - Part I
- District-wise Nutritional Indicators in Nagaland (1995-1996) - Part II
- District-wise Nutritional Status of Adult Population According to BMI Grades in Nagaland (1995-1996)
- District-wise Prevalence of Nutritional Deficiency Signs in Nagaland (1995-1996)
- District-wise Prevalence of Severe Undernutrition in Nagaland (1995-1996)
- District-wise Prevalence of Underweight, Stunting and Wasting in Nagaland (1995-1996)
- District-wise Protein and Calorie Adequacy Prevalence in Nagaland (1995-1996)
- Frequency of Consumption of Food by Households in Nagaland (1995-1996)
- Knowledge Attitude and Practice of Mothers in Nagaland (1995-1996)
- Percent Distribution of Adults-Body Mass Index (BMI) in Nagaland (1995-1996)
- Percent Distribution of Children-Height for Age in Nagaland (1995-1996)
- Percent Distribution of Children-Weight for Age in Nagaland (1995-1996)
- Percent Distribution of Children-Weight for Height in Nagaland (1995-1996)
- Percent Distribution of School Age Children and Adolescent-(Gomez Classification) in Nagaland (1995-1996)
- Prevalence of Nutritional Deficiency Signs in Nagaland (1995-1996)
- Protein Calorie Adequacy Status in Nagaland (1995-1996)
- MPCE Class-wise Average Number of Meals Consumed by Members per Household at Home and Away from Home (Free from School, Balwadi, from Employer as Perquisite or Part of Wage and other/on Payment) during a Period of 30 Days for Rural Areas in Nagaland (July 1993-June 1994)
- MPCE Class-wise Average Number of Meals Consumed by Members per Household at Home and Away from Home (Free from School, Balwadi, from Employer as Perquisite or Part of Wage and other/on Payment) during a Period of 30 Days for Urban Areas in Nagaland (July 1993-June 1994)
- MPCE Class-wise Per Households by Calorie Intake Level for Rural Areas in Nagaland (July 1993-June 1994)
- MPCE Class-wise Per Households by Calorie Intake Level for Urban Areas in Nagaland (July 1993-June 1994)
- MPCE Class-wise Per Persons by Calorie Intake Level for Rural Areas in Nagaland (July 1993-June 1994)
- MPCE Class-wise Per Persons by Calorie Intake Level for Urban Areas in Nagaland (July 1993-June 1994)
- MPCE Class-wise per Capita and per Consumer Unit Intake of Calories, Protein and Fat per Diem for Rural Areas in Nagaland (July 1993-June 1994)
- MPCE Class-wise per Capita and per Consumer Unit Intake of Calories, Protein and Fat per Diem for Urban Areas in Nagaland (July 1993-June 1994)
- MPCE Class-wise Percentage of Total Intake of Calorie and Protein from Different Groups of Food Items for Rural Areas in Nagaland (July 1993-June 1994)
- MPCE Class-wise Percentage of Total Intake of Calorie and Protein from Different Groups of Food Items for Urban Areas in Nagaland (July 1993-June 1994)
- Nutrition (1993-1994)
- Per Households Over Adjusted per Diem per Consumer Unit Calorie Intake Level by Reported per Diem per Consumer Unit Calorie Intake Level for Rural Areas in Nagaland (July 1993-June 1994)
- Per Households Over Adjusted per Diem per Consumer Unit Calorie Intake Level by Reported per Diem per Consumer Unit Calorie Intake Level for Urban Areas in Nagaland (July 1993-June 1994)
- Percentage Distribution of Calorie Intake per Consumer Unit per Diem Over Different Food Groups/Average Intake of Calorie, Protein and Fat per Consumer Unit per Diem by per Consumer Unit per Diem Calorie Intake Classes for Rural Areas in Nagaland (July 1993-June 1994)
- Percentage Distribution of Calorie Intake per Consumer Unit per Diem Over Different Food Groups/Average Intake of Calorie, Protein and Fat per Consumer Unit per Diem by per Consumer Unit per Diem Calorie Intake Classes for Urban Areas in Nagaland (July 1993-June 1994)
- Allocation under National IDD Central Programme for Women in Nagaland (1998-1999 to 2003-2004)


Associate Websites (56)
Sector-specific Websites (19)
IndiaAgristat
IndiaChildrenstat
IndiaChildrenstat
IndiaCrimestat
IndiaDemographics
IndiaDemographics
IndiaEconomystat
IndiaEducationstat
IndiaEducationstat
IndiaEnergystat
IndiaEnvironstat
IndiaEnvironstat
IndiaHealthstat
IndiaHousingstat
IndiaHousingstat
IndiaIndustrystat
IndiaInfrastat
IndiaInfrastat
IndiaLabourstat
IndiaRuralstat
IndiaRuralstat
IndiaSCSTstat
IndiaTourismstat
IndiaTourismstat
IndiaUrbanstat
IndiaWelfarestat
IndiaWomenstat
IndiaWelfarestat
IndiaWomenstat
State-specific Websites (31)
AndhraPradeshstat
ArunachalPradeshstat
Assamstat
Biharstat
ArunachalPradeshstat
Assamstat
Biharstat
Chandigarhstat
Chhattisgarhstat
Delhistat
Goastat
Chhattisgarhstat
Delhistat
Goastat
Gujaratstat
Haryanastat
HimachalPradeshstat
JammuandKashmirstat
Haryanastat
HimachalPradeshstat
JammuandKashmirstat
Jharkhandstat
Karnatakastat
Keralastat
MadhyaPradeshstat
Karnatakastat
Keralastat
MadhyaPradeshstat
Maharashtrastat
Manipurstat
Meghalayastat
Mizoramstat
Manipurstat
Meghalayastat
Mizoramstat
Sikkimstat
TamilNadustat
Telanganastat
Tripurastat
Telanganastat
Tripurastat
Uttarakhandstat
UttarPradeshstat
WestBengalstat
UttarPradeshstat
WestBengalstat
Regional Websites (6)
Eastern Indiastat
Southern Indiastat
Northern Indiastat
Western Indiastat
North-East Indiastat
Hindibelt

 Datanet India Initiatives

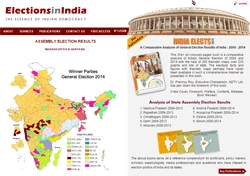

Provides constituency-wise election data for all 543 parliamentary and 4120 state assembly constituencies, since independence
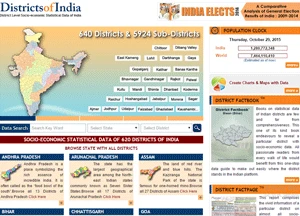

A storehouse of socio-economic statistical information of 620 districts of India
A Cluster of 660 Associate Websites

Over 1000 key statistical facts about India and the world have been presented in order of 10

A collection of election & reference books in print, eBook and Web based access formats
15 years of serving socio-economic & political research fraternity in India and abroad
Recognized by
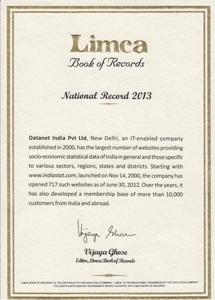
 for having the largest cluster of 717 websites providing socio−economic statistical data
Recognized by
for having the largest cluster of 717 websites providing socio−economic statistical data